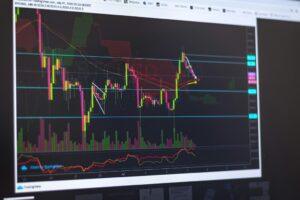
Here’s your ultimate guide to Technical Indicators & Chart Patterns — the toolkit every smart trader needs to master the markets 📈🔍
🧠 What Are Technical Indicators?
These are math-based tools applied to price and volume data to help:
-
Identify trends
-
Spot entry/exit points
-
Confirm buy/sell signals
-
Manage risk
🔥 Must-Know Technical Indicators
1. RSI (Relative Strength Index)
-
Measures momentum
-
Scale: 0 to 100
-
Overbought: > 70 (potential sell)
-
Oversold: < 30 (potential buy)
✅ Works great with divergence strategies
🧠 Use on: Daily or 4H charts for swing/positional
2. Moving Averages (SMA / EMA)
-
SMA (Simple Moving Average): Equal weight
-
EMA (Exponential): More weight to recent prices
💡 Popular MAs:
-
20 EMA – short-term trend
-
50/100/200 EMA – medium/long-term trend
📉 Crossovers signal trend change: -
Golden Cross (50 MA > 200 MA) = Bullish
-
Death Cross (50 MA < 200 MA) = Bearish
3. MACD (Moving Average Convergence Divergence)
-
Combines 2 EMAs (usually 12 & 26)
-
Signals: MACD line crosses Signal line
-
Good for momentum & trend reversals
🧠 Add histogram for visual confirmation
4. Bollinger Bands
-
Shows volatility and price range
-
3 Bands: Upper, Middle (20 MA), Lower
-
When price touches lower band = potential bounce
-
Squeeze = volatility breakout soon
5. Fibonacci Retracement
-
Used to find support/resistance in pullbacks
-
Common levels: 38.2%, 50%, 61.8%
-
Works great in trending markets for entry points
🎯 Combine with RSI or price action for confirmation
6. Volume
-
Confirms price action — “Volume precedes price”
-
Look for high volume on breakouts
-
Use Volume Profile or OBV (On Balance Volume) for deeper insights
🧱 Powerful Chart Patterns
✅ Reversal Patterns
| Pattern | Signal | Shape |
|---|---|---|
| Head & Shoulders | Bearish | Peak with 2 smaller ones |
| Inverse H&S | Bullish | Bottom-reversal |
| Double Top/Bottom | Reversal | “M” or “W” shape |
✅ Continuation Patterns
| Pattern | Trend Suggestion | Notes |
|---|---|---|
| Flags & Pennants | Bullish/Bearish | Short consolidation, then breakout |
| Triangles (Sym/Asc/Desc) | Either Direction | Depends on breakout side |
| Cup & Handle | Bullish | Long-term bullish continuation |
✅ Candlestick Patterns
| Pattern | Type | Meaning |
|---|---|---|
| Hammer / Inverted | Bullish Reversal | Found at bottom of downtrend |
| Doji / Spinning Top | Neutral | Indecision, prepare for move |
| Engulfing (Bull/Bear) | Reversal | Strong signal if on key level |
🔧 Tools to Use
| Platform | Use For |
|---|---|
| TradingView | Charting, indicators, backtests |
| Chartink | Indian screeners with patterns |
| Investing.com | Global indicators & technicals |
| Zerodha Kite / Upstox | Real-time charting (India) |
🛑 Pro Tips for Smart Use
-
Never rely on 1 indicator alone
Combine 2–3 (e.g., RSI + MA + Volume) -
Use higher timeframes (1D or 4H) for confirmation
-
Always define stop-loss and target levels based on patterns
-
Use alert systems (like TradingView) to notify key setups
📘 Example Combo Setup:
Swing Buy Setup
-
20 EMA above 50 EMA (trend)
-
RSI at 40 and rising (momentum)
-
Price pulling back to 50% Fibonacci
-
Bullish Engulfing candle at support
🔥 High probability trade!
🎯 Want a Personalized Indicator Strategy?
Tell me:
-
Your trading style (intraday, swing, positional)
-
Risk level (low/medium/high)
-
Capital available
I’ll build you a custom strategy using the best indicators + patterns for your goals 📊🚀
Let’s decode the charts and trade smarter!


